
Insights to grow philanthropic giving for not-for-profits
Recent research identifies key opportunities to increase philanthropic giving with implications for not-for-profit organisations.
Philanthropy plays an important role in our society; supporting diverse charities, not-for-profit organisations and community groups to form the social capital, which strengthens communities across the country.
Australia is a generous nation. We rank fifth in the World Giving Index which considers three measures of generosity: financial, volunteering, and willingness to help a stranger.1 But on financial measures of generosity, we are slipping. New data from the Australian Taxation Office suggests that Australia is becoming less generous, with the share of people claiming tax deductible donations falling yet again, now at its lowest level since the 1970s.2
There are opportunities to turn this trend around. One such opportunity is the unprecedented $2.6 trillion that is expected to transfer from baby boomers3 to their children over the next 20 years. To explore this and other opportunities, Philanthropy Australia commissioned SVA to help develop the Blueprint to Grow Structured Giving: How Australia can double structured giving by 2030 (‘the Blueprint’).
Structured giving involves using a financial vehicle designed to enable giving, usually through providing a tax incentive. These vehicles include private or public ancillary funds, sub-funds, giving circles and some forms of trust.4 This is distinct from mass-market and other forms of giving such as direct donations to charities, crowd-funding or volunteering which make up the bulk of giving in Australia. While the primary focus of the research and report was on identifying strategies to grow structured giving, some of the insights apply more broadly. (For more information on structured giving vehicles, see page 8 of the Blueprint.
This article shares some of the key opportunities identified in the research, and the implications for not-for-profits looking to attract more philanthropic giving.
Current giving levels
Australian giving: a global context
In 2018-19, the total amount Australians gave to charitable causes was estimated to be $15.2 billion.5 Structured giving comprised 17% of the total, at $2.6 billion. (See Figure 1.)

On financial measures of generosity, Australia lags behind its peers, including the United Kingdom, Canada, New Zealand and the US on many benchmarks for philanthropic giving. (See Figure 2.)
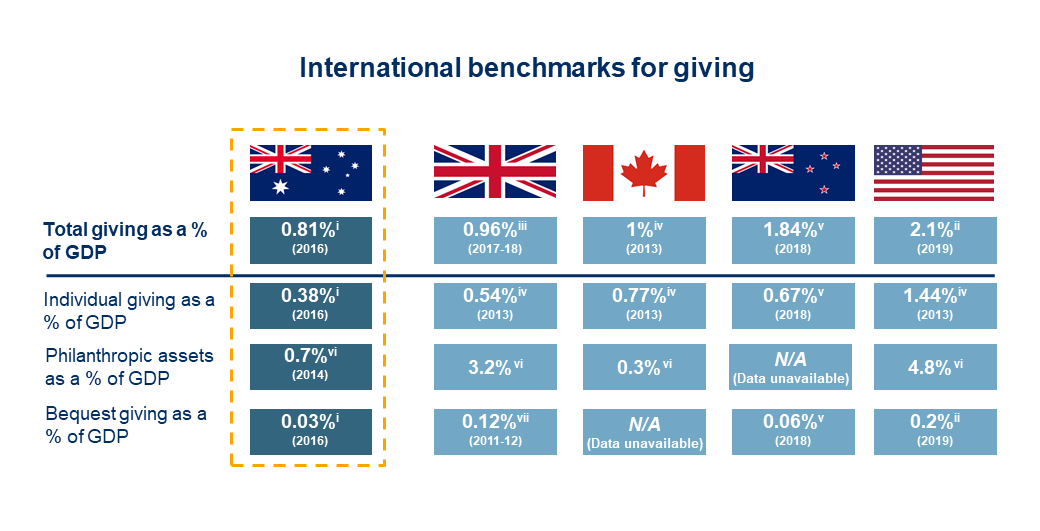
Total giving as a proportion of GDP sits at around 0.8% in Australia, compared to almost 1% in the United Kingdom, and 2% in the US. Australia’s bequest giving (through wills) and individual (mass market) giving rates as a proportion of GDP are also below those of peers.
While comparisons with other nations should be made with caution given the varying political and social contexts, tax regimes and philanthropic traditions, there is significant room for Australia to enhance its culture of giving.
Declining giving levels: from taxpayer claims
In analysing giving levels in Australia over time, the overall quantum of giving has been increasing year on year – thanks to population growth and increases in the average gift size per person. However, tax data shows that participation in giving in Australia has been trending down since around 2005 (Figure 3) and is now at its lowest point since the 1970s.7
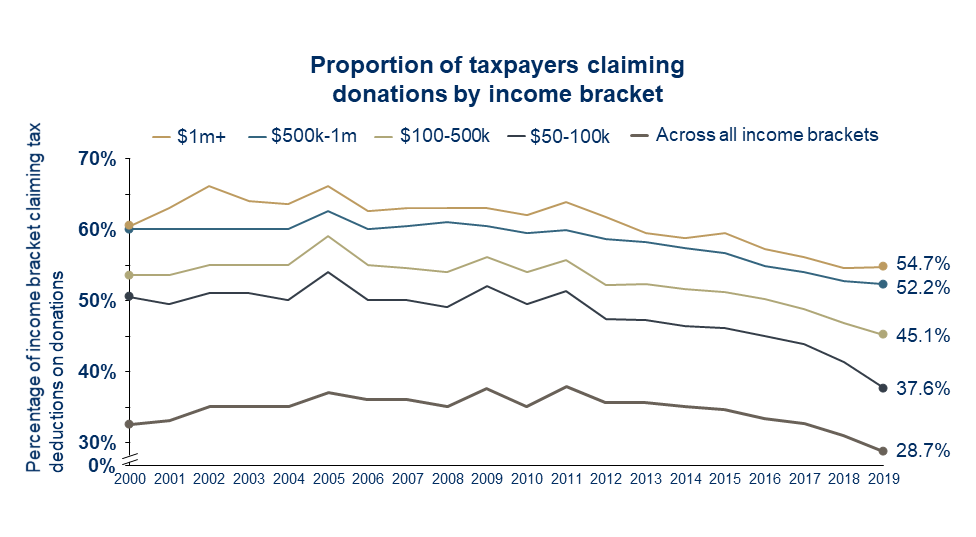
Concerningly, the percentage of people with taxable income over $1m who are giving is now just 54.7%. This contrasts with the US where for that income category it is up at 90%.8
Insights for not-for-profits to increase philanthropic giving
Not-for-profits often feel that they compete amongst one another for donors, rather than looking to ‘grow the pie’ of total donors in Australia. Little wonder, with a shrinking proportion of Australians donating. However, it is in the not-for-profit’s interests to grow both the number of donors and the average amount donated. This will lead to a slice of a bigger pie.
From the research, there are five opportunities identified which have implications for not-for-profits to attract more philanthropic giving:
- Capturing a share of the intergenerational wealth transfer
- Leveraging interest in community and place-based philanthropy
- Establishing giving attitudes earlier in life
- Increasing fundraising capabilities and focus within the executive
- Building and maintaining public trust in charities.
See page 10 of the Blueprint for other opportunities to grow structured giving more specifically.
1. Capturing a share of the intergenerational wealth transfer
Australia is expecting an unprecedented $2.6 trillion to be transferred between generations from 2021 to 2040; $1.1 trillion of which will be passed down over the next 10 years.9
Some 39% of the average Australian household wealth of $1,026,000 is tied up in owner-occupied housing. However as Jack Heath, CEO of Philanthropy Australia said: “There’s a significant proportion not tied in the home [in superannuation (21%), shares and investment properties]. We see this as a significant opportunity to tap into that wealth transfer and direct those dollars to philanthropic causes.”
The Blueprint identifies strategies to unlock those assets, including through removing barriers to giving from superannuation, and making it easier for people to gift a portion of their home or other significant assets while alive.10 However, for now, capturing a share of that transfer for charitable causes will most likely occur on the death of the donor, through a will or another testamentary vehicle.
Data can help target efforts to encourage more people to give. Within the 2021-2040 period, 38% of the $2.6 trillion wealth transfer is expected to be from the over 85-year-old group. Given a longer life expectancy, women are expected to account for 54% of the household wealth transferred from these households. These potential donors are now in their 60s and 70s. Efforts to engage them in giving through estate planning should start now.
Research shows that the proportion of those who have a will peaks in the top age range surveyed, the 65-74 age cohort at about 88% compared to just 50% of the total population.11 The proportion of people giving through wills has been stagnant at around 7% for years. But there is evidence that supporting professional advisors to encourage their clients to leave gifts in their wills could shift this trend.12
“The point is to understand where that wealth transfer will take place…”
Analysis by Seer Data & Analytics shows that the bulk of the wealth transfer will occur in Australia’s largest population centres on the East coast, predominantly in NSW and Victoria (see Blueprint, page 11). However, a considerable amount of wealth also sits in Australia’s regions. Almost a third (29%) of wealth will transfer outside of our cities – $333 billion by 2030, presenting an opportunity for community foundations and other organisations working in regional centres to grow giving.
As Heath said: “The point is to understand where that wealth transfer will take place and to establish practices, policies, enticements to target communities, so that people are thinking when they’re passing down the wealth, ‘What can I do in the philanthropic space?’”
What does all this mean for organisations looking to raise funds? Focus on growing bequests, including by targeting high net worth individuals, specific age cohorts and geographical areas of wealth. While it’s a long game strategy, the potential return is huge.
2. Leveraging interest in community and place-based philanthropy
Australians have long valued grassroots community-focused efforts, including local leadership and philanthropic support. This trend is accelerating. Connections to people and place often run deep, and the impetus for individuals to give where they live or to places with which they have a connection through their family, life or work can be strong.13
“We’re starting to see an increase in, and interest for, community foundations…”
In recent years, community philanthropy and place-based giving has gained traction as a mechanism to help address local challenges and drive social change both in Australia and overseas, particularly in countries such as Canada and the United Kingdom.
Community foundations are independent philanthropic organisations that enable local donors to create permanent endowments that benefit a specific geographic area or community group. A significant proportion of sub-funds are managed by community foundations. At the end of 2018-19, community foundations had over $452 million in funds under management.
“We’ve seen a rise in place-based philanthropy in Australia brought about by the response to bush fires, floods and Covid – where we stayed in our immediate geographical community,” said Heath. “And we’re starting to see an increase in, and interest for, community foundations. But we’re still a long, long way away from where Canada is.”
There are currently 40 community foundations in Australia, with 80% working in regional areas. In comparison, Canada has over 190 community foundations. If the number of Australian community foundations grow to match the relative number in Canada (population adjusted) there could be up to $110 million per annum in additional distributions to local charitable organisations.
This growth could be enabled in part through the considerable wealth and assets that sit in Australia’s regions (described above). Table 1 outlines the top 12 regions across the country (Statistical Area Level 2s), expecting the highest total wealth transfer, together with their current donation and volunteering levels.
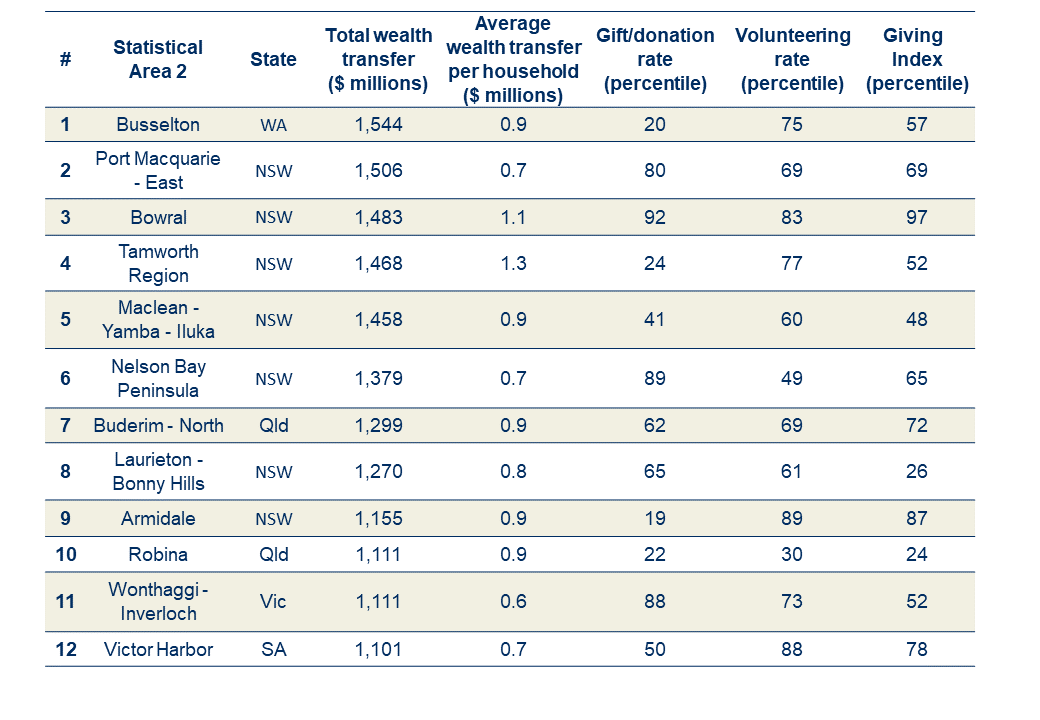
Some of the areas with the highest intergenerational wealth transfer potential, such as Bowral and Port Macquarie-East in NSW, also have high giving levels, so the likelihood of capturing a share of the transfer in those locations for charitable causes is high. In areas with relatively lower giving levels but large wealth transfers such as the Tamworth region in NSW and Busselton in WA, there is potential to ‘activate’ these areas to give more too. They also have high volunteering rates. (Research shows that those who volunteer are more likely to donate.15)
Community foundations and other locally-based structured giving mechanisms are well-placed to enable giving to local organisations. More than just ‘funding’ organisations, they add significant local value and insight to the funds they receive and then grant. Recent work led by the peak body, Australian Community Philanthropy, explores the opportunity to grow community foundations across Australia.16
So what are the implications for not-for-profits? Look local – as those who are inclined to give are looking local too, and may have a greater potential to give than you realise.
3. Establishing giving attitudes earlier in life
Behavioural science tells us that attitudes towards giving can be difficult to ‘nudge’ later in life once behaviours are set. We tend to stick to the status quo, or a view that we’ve long held, even if a different choice would better align with our current personal beliefs or goals.17
As Robert Slonim, Professor at the School of Economics at the University of Sydney described: “Status quo bias is one of the most important behavioural insights in the last 40 years that can be applied to philanthropy. It suggests that if you have donated or volunteered in the past, you’re more likely to donate later, as it’s an established part of your identity. If someone has not given before, it will be harder to convince them to start.”
This points to the significance of influencing a person to give earlier in their lifetime.
While an individual’s financial capacity to give early in their life may be low, experiences that raise awareness about community needs and the benefits of giving can strengthen the propensity to give over time.18 If younger generations can be engaged early in a culture of giving this is likely to build a stronger pipeline of future philanthropists.
“… build a strategy around how you begin that giving journey early…”
Efforts to encourage giving could start as early as school. There are a number of programs already running in Australia that address the value of building a culture of philanthropy in school-aged children.19 These are currently at a small scale, but evaluations have found them to be successful in fostering a culture of giving in school communities.
The workplace is another important place to raise awareness about giving, and may cement giving behaviours in more junior employees. Workplace giving and specifically giving circles show tremendous promise in strengthening Australia’s culture of giving. An evaluation of a giving circle at a work pilot program at Westpac found it had increased giving levels amongst employees, as well as motivating matched giving by the employer.20 Strong corporate cultures of giving are also hugely influential. For instance, giving amongst JB Hi-Fi staff is such an engrained part of their culture that 75% of staff give to charity through workplace giving.21
Slonim says: “To build a strategy around how you begin that giving journey early would be a great start”.
So for not-for-profits looking to fundraise – engaging early and for the long haul may well pay dividends. Engage with local schools to build awareness, and with workplace initiatives to encourage employee giving and volunteering. Small donations or volunteering earlier in a donor’s life plant the seed for bigger donations to come.
4. Increasing fundraising capabilities and focus within the executive
Effective fundraising is crucial. Studies show that for more than 85% of donations, the key reason people donated was simply because someone asked them.22 We also know that the use of professional fundraising services by charities increases the effectiveness of fundraising efforts.23 However, research has also highlighted the need for fundraising to be embedded within the organisation’s leadership – ‘fundraising doesn’t happen if you don’t have strong leadership’.24
As philanthropic strategy consultant Frankie Airey, from Philanthropy Squared, shared: “You can tell where a donor sits in the organisation’s mindset by where the head of fundraising sits in the organisation’s hierarchy. It’s a great indicator of how seriously an organisation takes its fundraising.”
Despite strong recognition that boards as well as CEOs need to be well informed and involved in fundraising, research has found gaps in their capacity to fulfil this role.25 While training and development is available for professional fundraisers, there is a lack of demand for, and provision of, such opportunities for board directors, CEOs and executives.26 Ensuring fundraising is a component of organisational strategy could also be key to capturing their attention at a critical decision point.
What does this mean for not-for-profits already fundraising? If it’s not already the case, ensure the CEO and board have a strong understanding of fundraising and give strategic consideration to how donors are thoughtfully engaged, and consider the fundraising function being positioned on the leadership team.
5. Building and maintaining public trust in charities
A key motivator of giving is donors’ perception that their contribution makes a difference to the cause they are supporting. This can be fostered by ensuring there is a high level of public trust in not-for-profits, including that they spend their resources well.27
Australian not-for-profits are generally perceived to be trusted – but there is room for improvement. The Australian Charities and Not-for-Profit’s Commission’s (ACNC) report on Public Trust and Confidence in Charities (2017), saw a decrease in those who believe most charities are trustworthy (20%) compared to the previous rounds of research (29% in 2013, 29% in 2015). More recently, the Edelman Trust Barometer (2021) found that trust in all institutions in Australia was at an all-time high, seemingly buoyed by Australia’s response to Covid, with not-for-profits more trusted (62%) than government (61%). However, there was a big gap in perceptions of trust between the ‘well informed public’ and the ‘general public’ – who are far more sceptical (a 21 percentage point gap).28
“For charities, public trust underpins viability.”
Trust can be achieved by maintaining transparency and accountability mechanisms for not-for-profits – a role the ACNC is charged with upholding. This is complemented by ongoing public awareness and education about the important role that charities play in our community and the impact they have with donor dollars – something that not-for-profits must champion.
As David Crosbie, CEO of the Charities Council of Australia has shared: “For charities, public trust underpins viability. People’s willingness to get involved – to donate time and money – is grounded in public trust. Charities need to demonstrate and communicate the value they offer their community, to show how they achieve their purpose. We need to be focused more on impact and outcomes, the communities we serve and how we can do that better.”
This has the benefit of raising awareness about the need in society that not-for-profits are addressing – a win-win for fundraising efforts.
What can not-for-profits do? Maintain commitment to best practice management and transparency of operations, continue to raise awareness with current and potential donors about the impact you are having, and be thoughtful about how that impact is communicated.
A slice of a bigger pie?
Australia is a wealthy and generous nation, and the need in our communities has never been greater.
Philanthropy Australia’s Blueprint outlines a roadmap for how Philanthropy Australia and leaders across the social, business and government sectors can work together to supercharge Australia’s culture of planned and structured giving by 2030. This work will help to grow the size of the giving pie in Australia.
Building on the opportunities outlined above, not-for-profits can both support this broader work to increase philanthropic giving and increase their slice of the bigger philanthropic pie.
For more information, contact Doug Hume at dhume@socialventures.com.au
Notes
1 Charities Aid Foundation (2021), World Giving Index 2021
2 Sydney Morning Herald (2021), New research shows Australians aren’t as charitable as they used to be
3 The demographic cohort born during the post-World War II baby boom, approximately between the years 1946 and 1963.
4 Structured giving can also occur without using a dedicated vehicle, through corporate cash donations, or larger scale and planned contributions from individuals and families. While giving from corporate foundations are a form of structured giving, they were not a focus of the first phase of the Blueprint.
5 A note on the giving data that appears through this article and the Blueprint. Estimates are informed by comprehensive modelling undertaken by JBWere Philanthropic Services in 2018 for The Support Report, as well as updates to short term estimates published in JBWere’s The outlook for philanthropy during Covid-19 (April, 2020). At the time of this article’s publication, 2018-19 is the most recent year for which there is ATO tax data available.
6 (i) JBWere (2018), The Support Report; (ii) Giving USA Report (2020). Sources and assumptions not available; (iii) ACF (2019) Foundation Giving Trends 2019; (iv) CAF (2016), Gross Domestic Philanthropy; (v) JBWere (2020), The NZ Support Report; (vi) Harvard (2018), Global Philanthropy Report; (vii) Scaife, W., McGregor-Lowndes, M., Barraket, J. and Burns, W. (2016), Giving Australia 2016. Literature Review. Note that ‘Philanthropic Assets’ refers to donations that are sitting within structured giving vehicles such as PAFs and PuAFs yet to be distributed to charities. In Australia, there are legal requirements about how much of these funds are distributed annually.
7 ATO data, JBWere and SVA analysis. Note this captures tax deductible donations, which generally reflects about a third of mass market donations. However, it does provide a consistent longitudinal data source and picture of the trends.
8 JBWere (2018), The Support Report
9 SVA analysis of “Intergenerational Wealth Transfer Estimate 2015-2060” data set provided by Seer Data and Analytics.
10 For example, the proposed new Living Legacy Trust structure described in the Blueprint.
11 McGregor-Lowndes, M., Crittall M., Conroy, D. and Keast, R. with Baker, C., Barraket, J. and Scaife, W. (2017), Individual giving and volunteering. Giving Australia 2016.
12 See Remember a Charity (2016), Research sheds new light on the role of solicitors in facilitating legacy giving and Legacy Foresight (2019), Australian Gifts in Wills 2040.
13 Research shows that knowing an end beneficiary or having a connection to a cause can increase the likelihood of giving. Wiepking and Bekkers (2010) ‘8 Mechanisms That Drive Charitable Giving’
14 Table presents a selection of Seer Data & Analytics’ ‘Intergenerational Wealth Transfer Estimate 2015-2060‘, combined with volunteering and giving percentiles calculated by Seer Data, using their ‘Willingness to Give Index’. Areas are ranked using a percentile method. e.g. an area in the 95th percentile for its ‘Gift/donation rate’ places it in the top 5% of all areas in terms of gifting/donating.
15 Analysis undertaken by Seer Data & Analytics for the Blueprint highlighted that communities exhibit an additional 3.5 percent rate of giving for every additional 10 percent rate of volunteering.
16 Australian Community Philanthropy (2020), Community Foundations in Australia: Blueprint for Growth.
17 Robitaille, N (2019), A little nudge goes a long way to increasing organ donor registrations.
18 Breeze, B (2010), How Donors Choose Charities.
19 See Kids in Philanthropy, LMCF’s Youth in Philanthropy program and SchoolAid
20 Seibert, K and Joyce, A (2020), Evaluation of the Giving Circles at Work Pilot.
21 See JB Hi-Fi’s Helping Hands program.
22 Konrath, S. and Handy, F. (2017), Conversation article, 5 reasons why people give their money away
23 Marudas, N. and Jacobs, F (2010) – Initial evidence on whether use of professional fundraising services increases fundraising effectiveness
24 Giving Australia 2016. Literature Review, Chapter 14, Non profit CEOs, quoting Scaife, Crittall and McDonald (2015).
25 Giving Australia 2016. Literature Review, Chapter 14, Non profit CEOs
26 Ibid.
27 Wiepking, P. and Handy, F. (2015) Facilitating Factors from a Cross-National Perspective; Bekkers, R. and Wiepking, P. (2010), Eight Mechanisms That Drive Charitable Giving
28 Edelman (2021) Trust barometer 2021 Australia. See also the Next25 Navigator Social Research Report (2021) which found that almost twice as many of us (40%) believe that NGOs act in the public interest as politicians.